Product
FolioViz
Financial portfolio visualization and a trading journal.
A market read, a paper-trading sandbox, and a place to record what you actually did and why. Twelve public surfaces — from a full S&P 500 heatmap to a blind chart-replay simulator — one frame from each below.
Captured — interface examples, not live figures.
Every screen
Captured signed out, so the personal surfaces show the sign-in walls and empty states a new visitor actually sees.
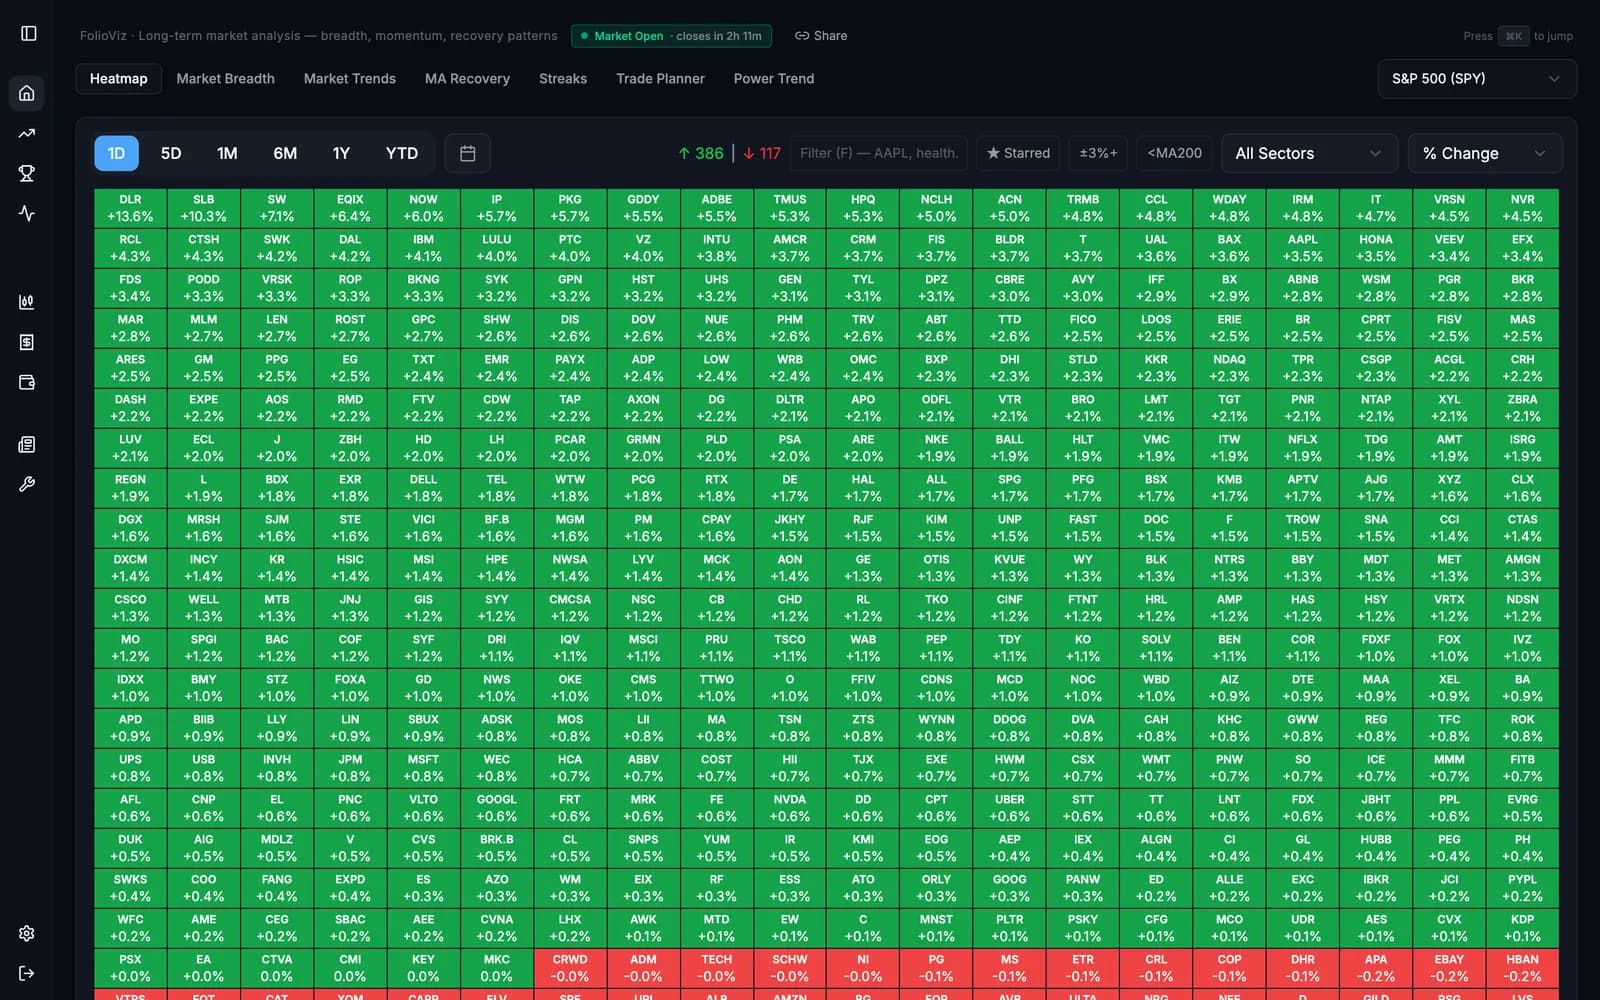
FolioPulse
Long-term market analysis: a full S&P 500 heatmap with breadth, momentum and recovery views.
/foliopulse
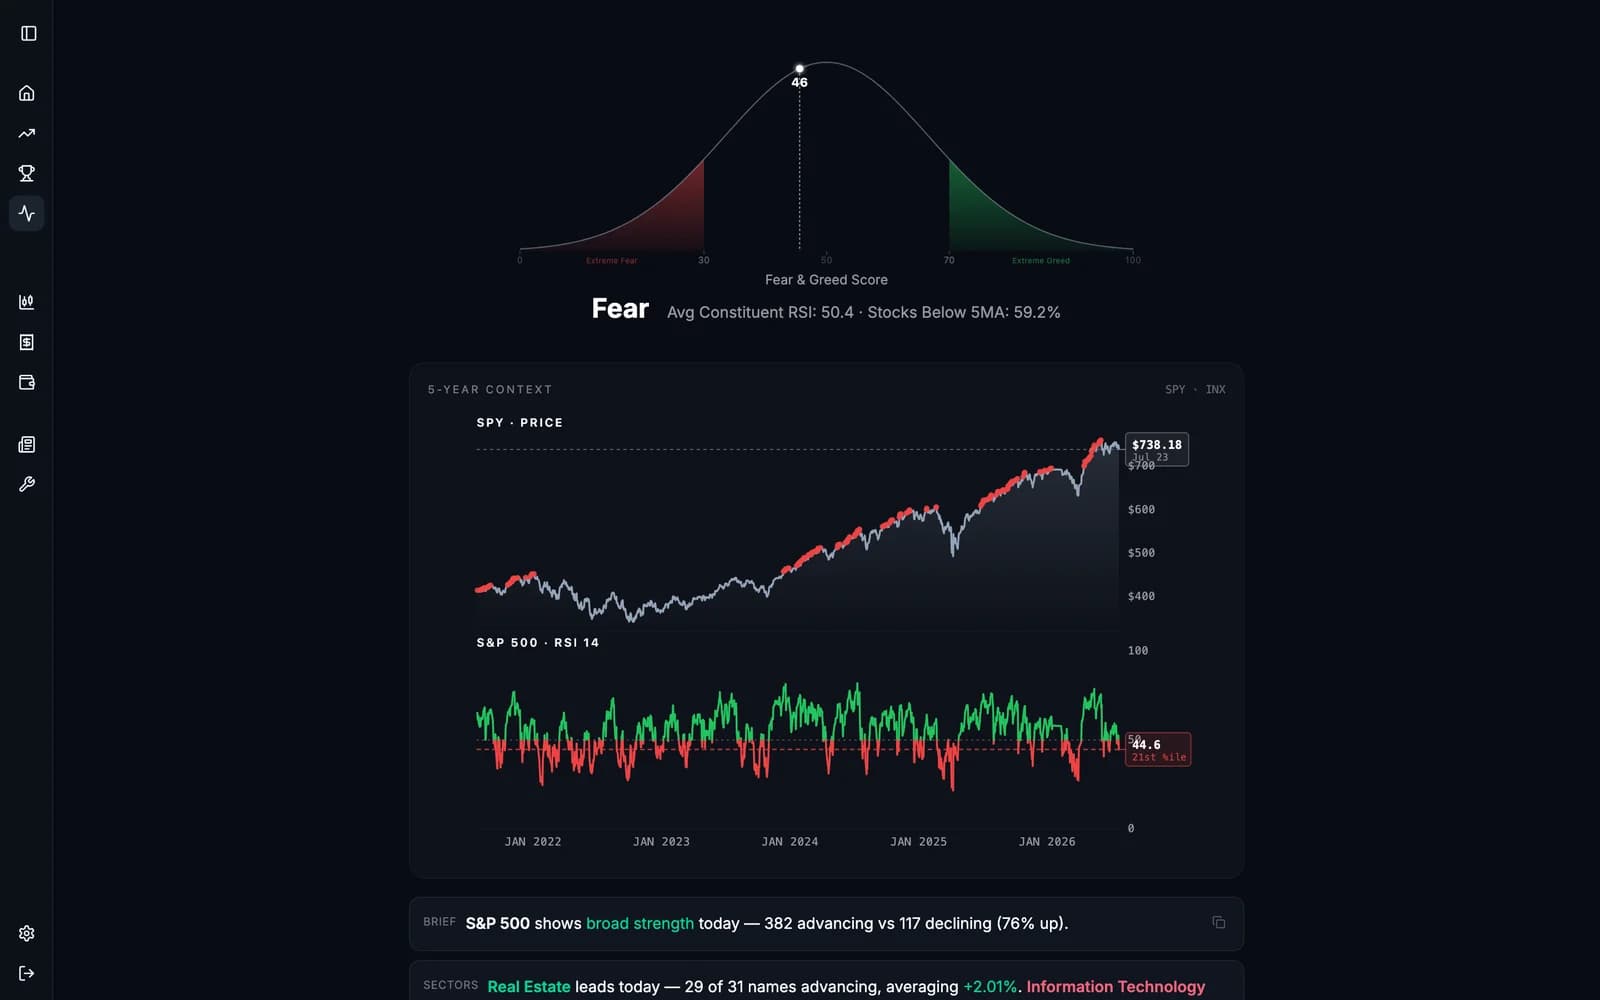
Market Pulse
A daily sentiment read — a Fear & Greed gauge over five years of SPY price and RSI.
/pulse
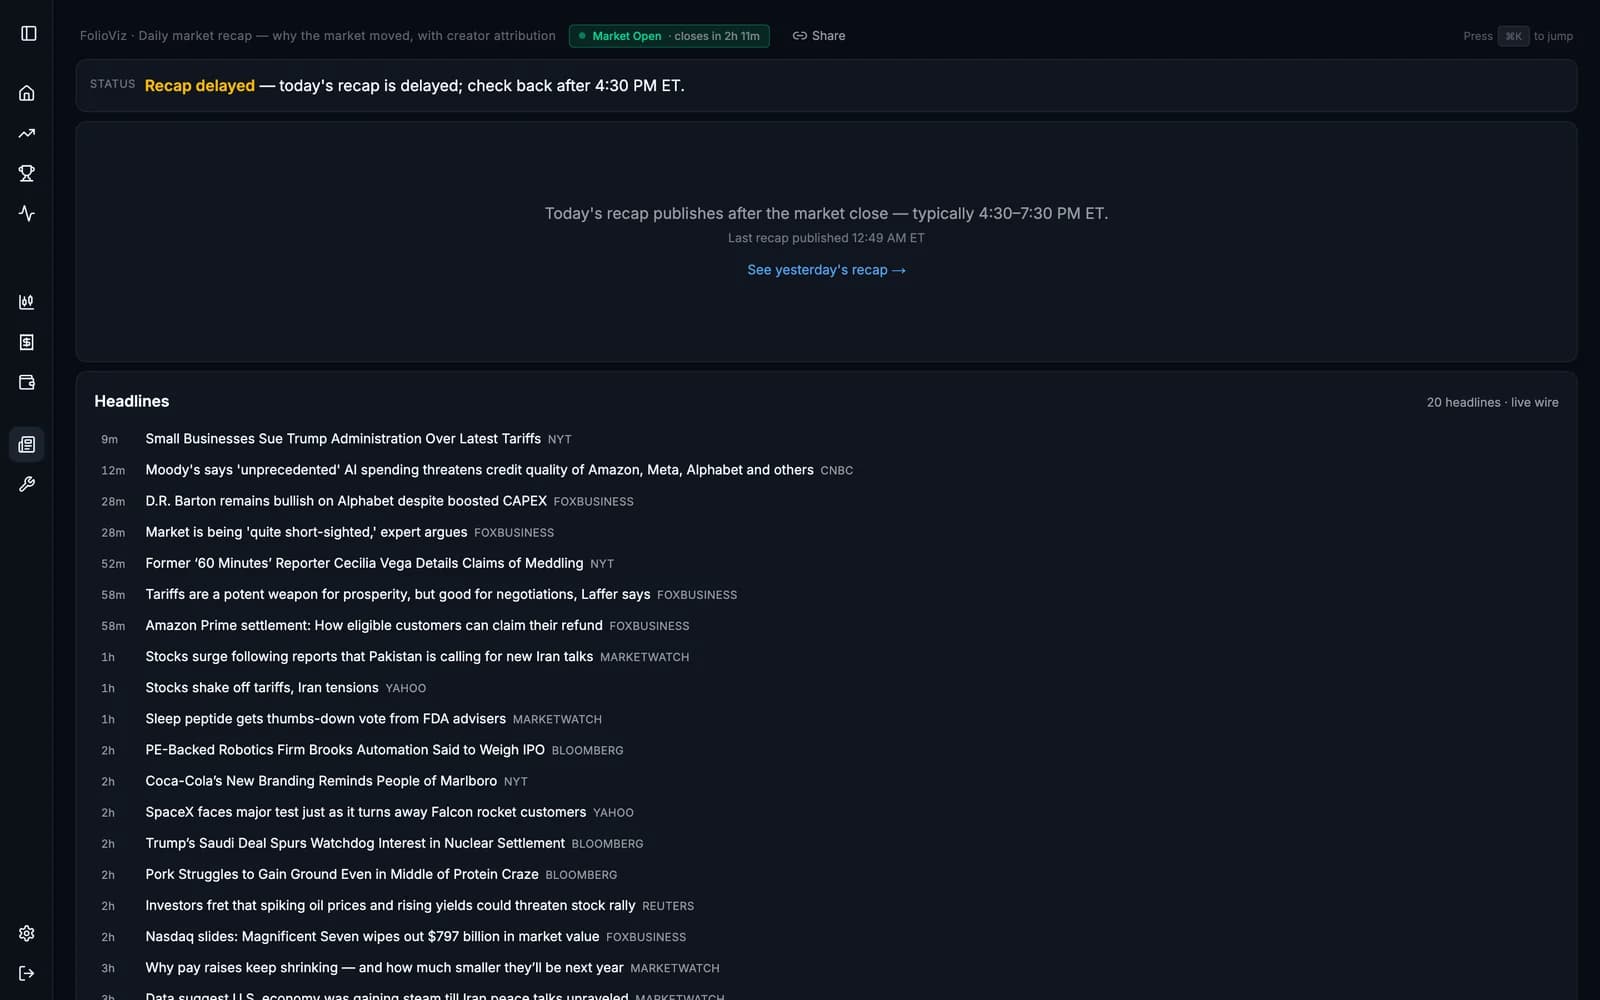
News
A market recap that publishes after the close, over a live headline wire attributing each item to its source.
/news
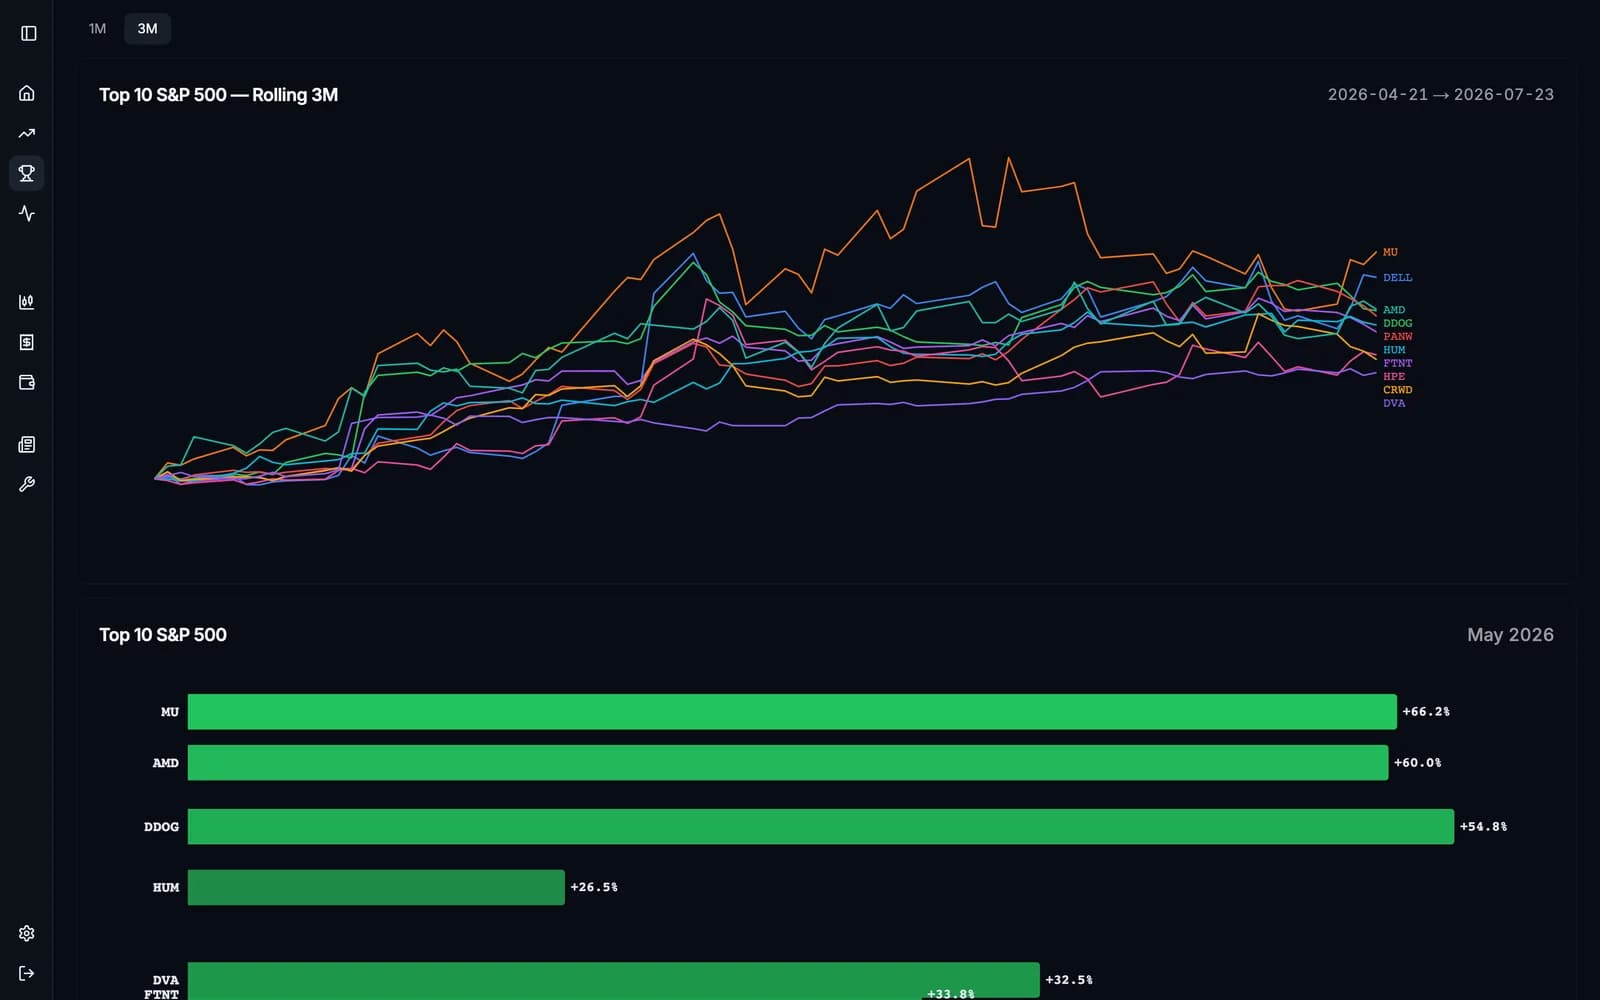
Top 10 Race
An animated race chart ranking the ten strongest S&P 500 names over a rolling window.
/top10race
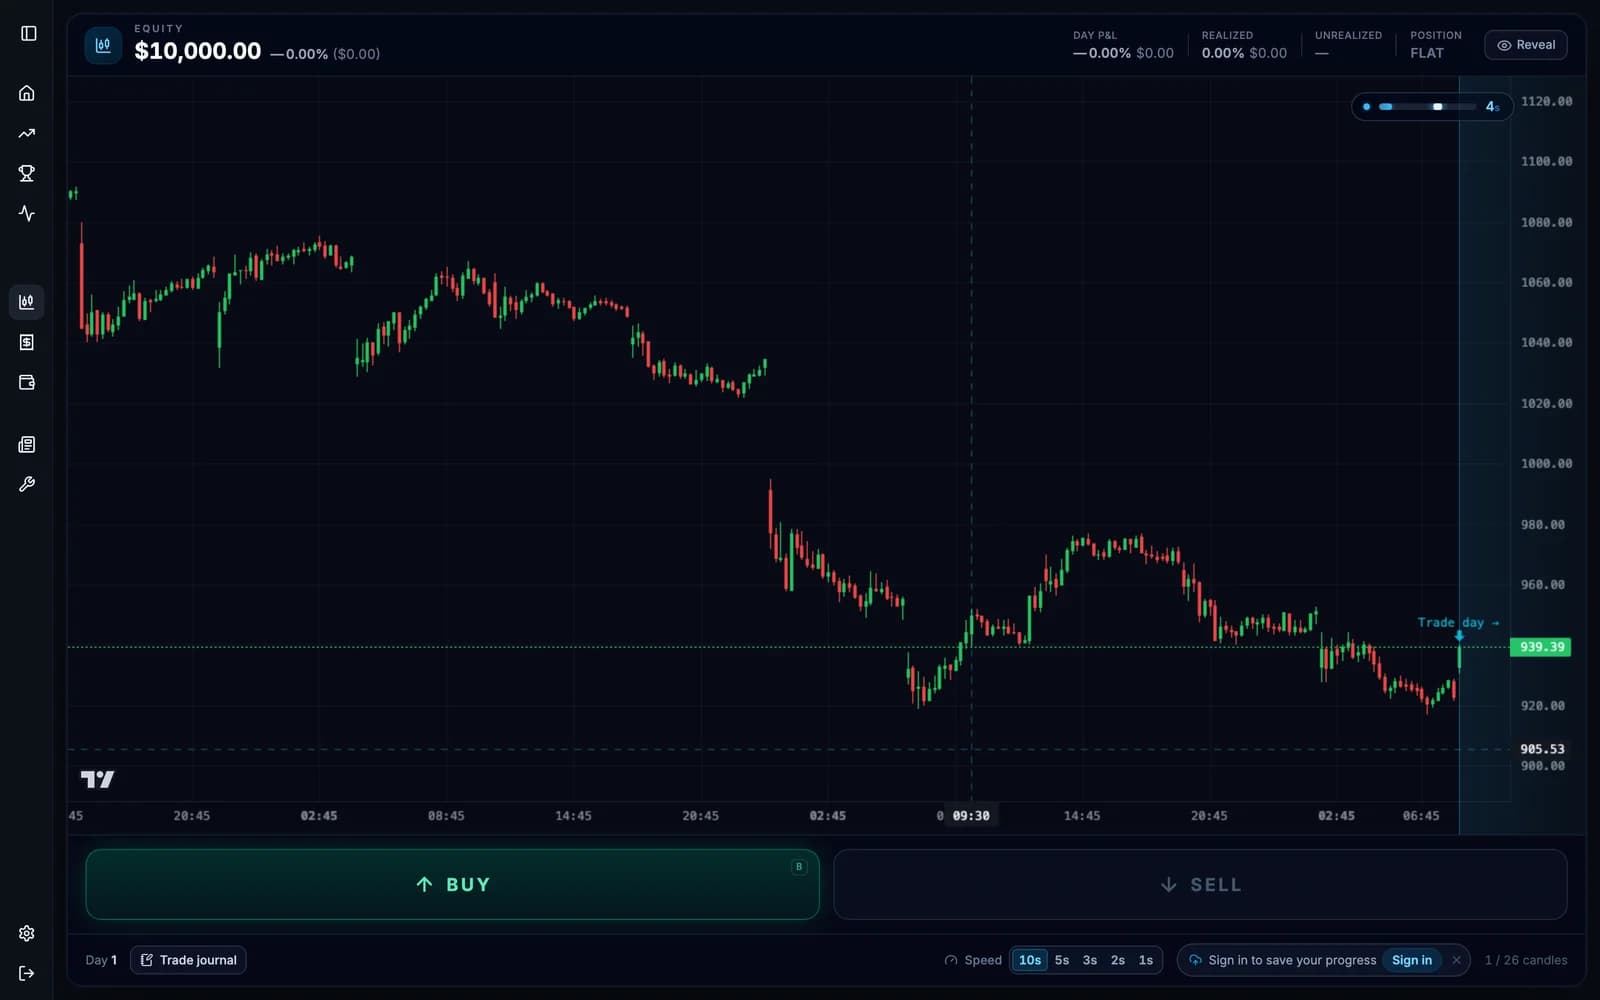
Chart Trainer
Demo dataA blind replay simulator that plays a real past trading day forward one candle at a time.
/day-trader
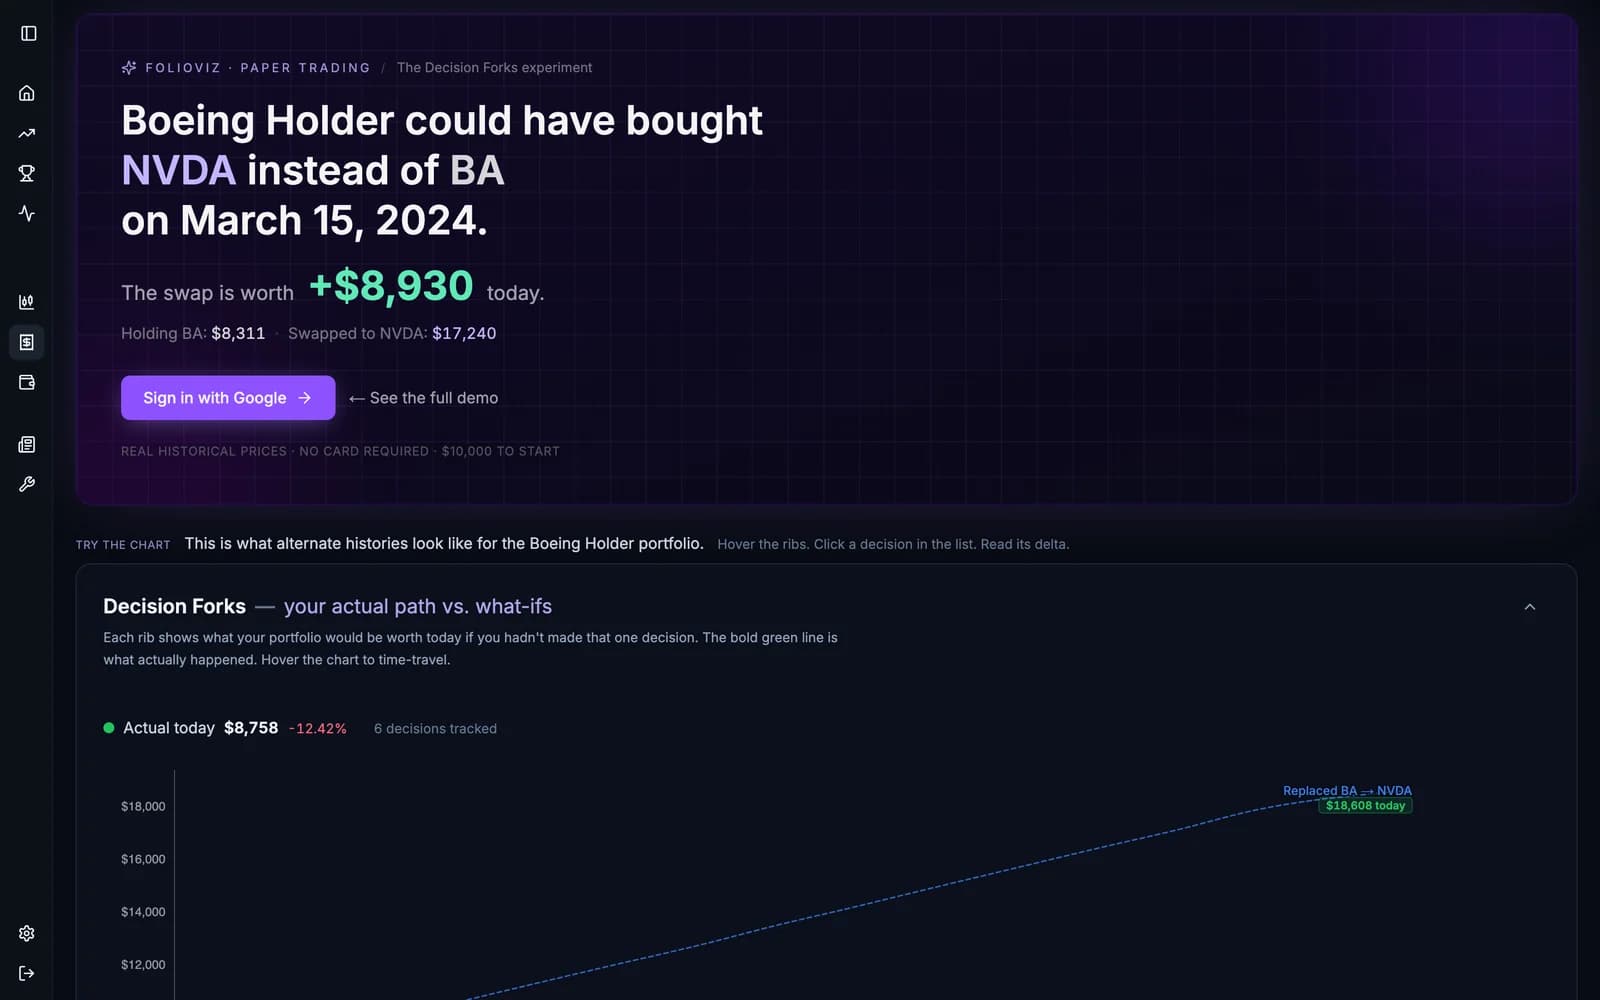
Paper Trading
Demo dataPaper trading built around Decision Forks — what a portfolio would be worth without any one past decision.
/paper-trading
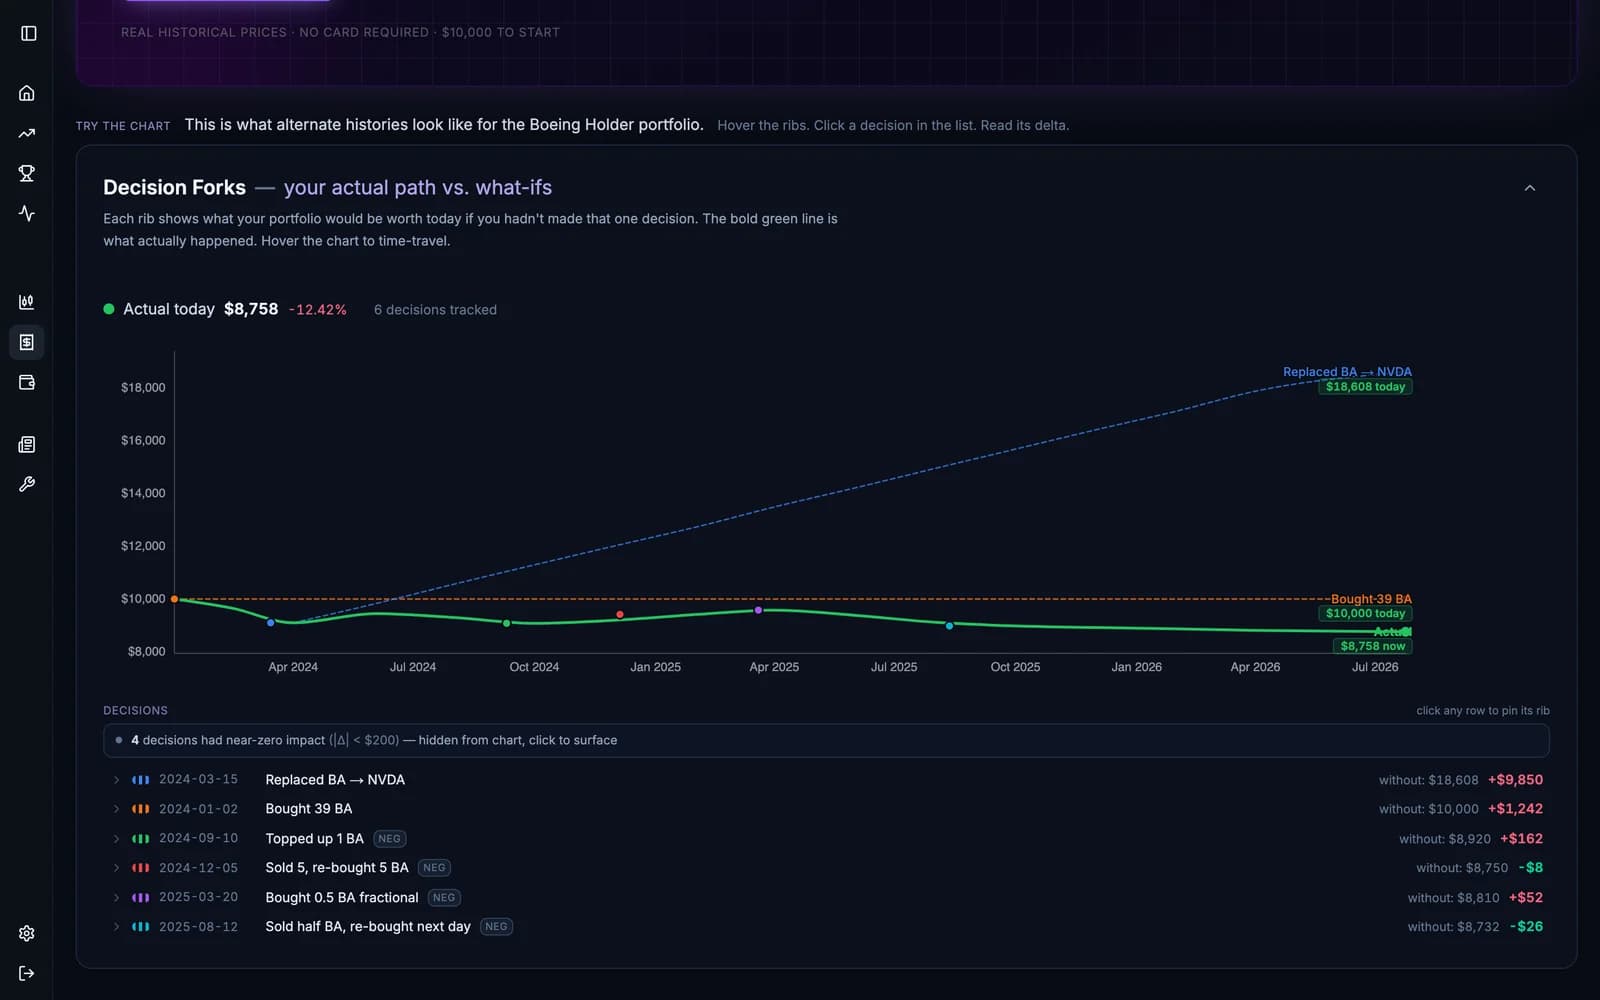
Decision Forks
Signed-out viewSigned out, the dashboard route falls back to the public demo: an actual path plotted against six what-if branches.
/paper-trading/dashboard
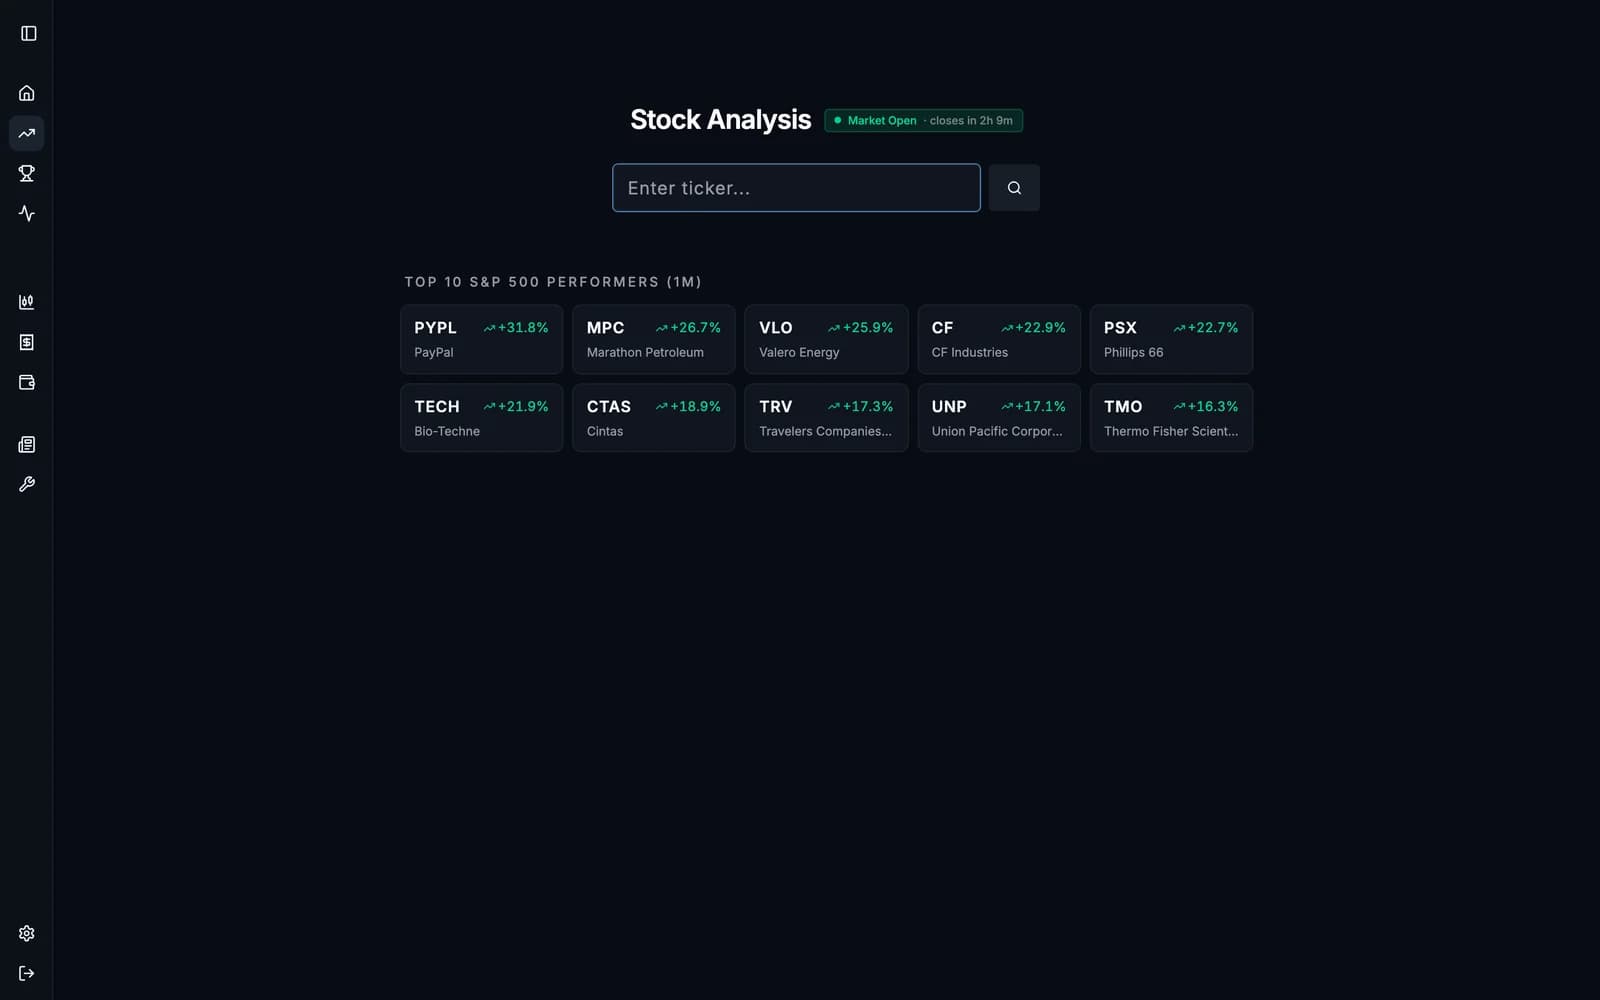
Stock Analysis
Per-ticker analysis by search, with the month's strongest S&P 500 movers as a starting point.
/stock
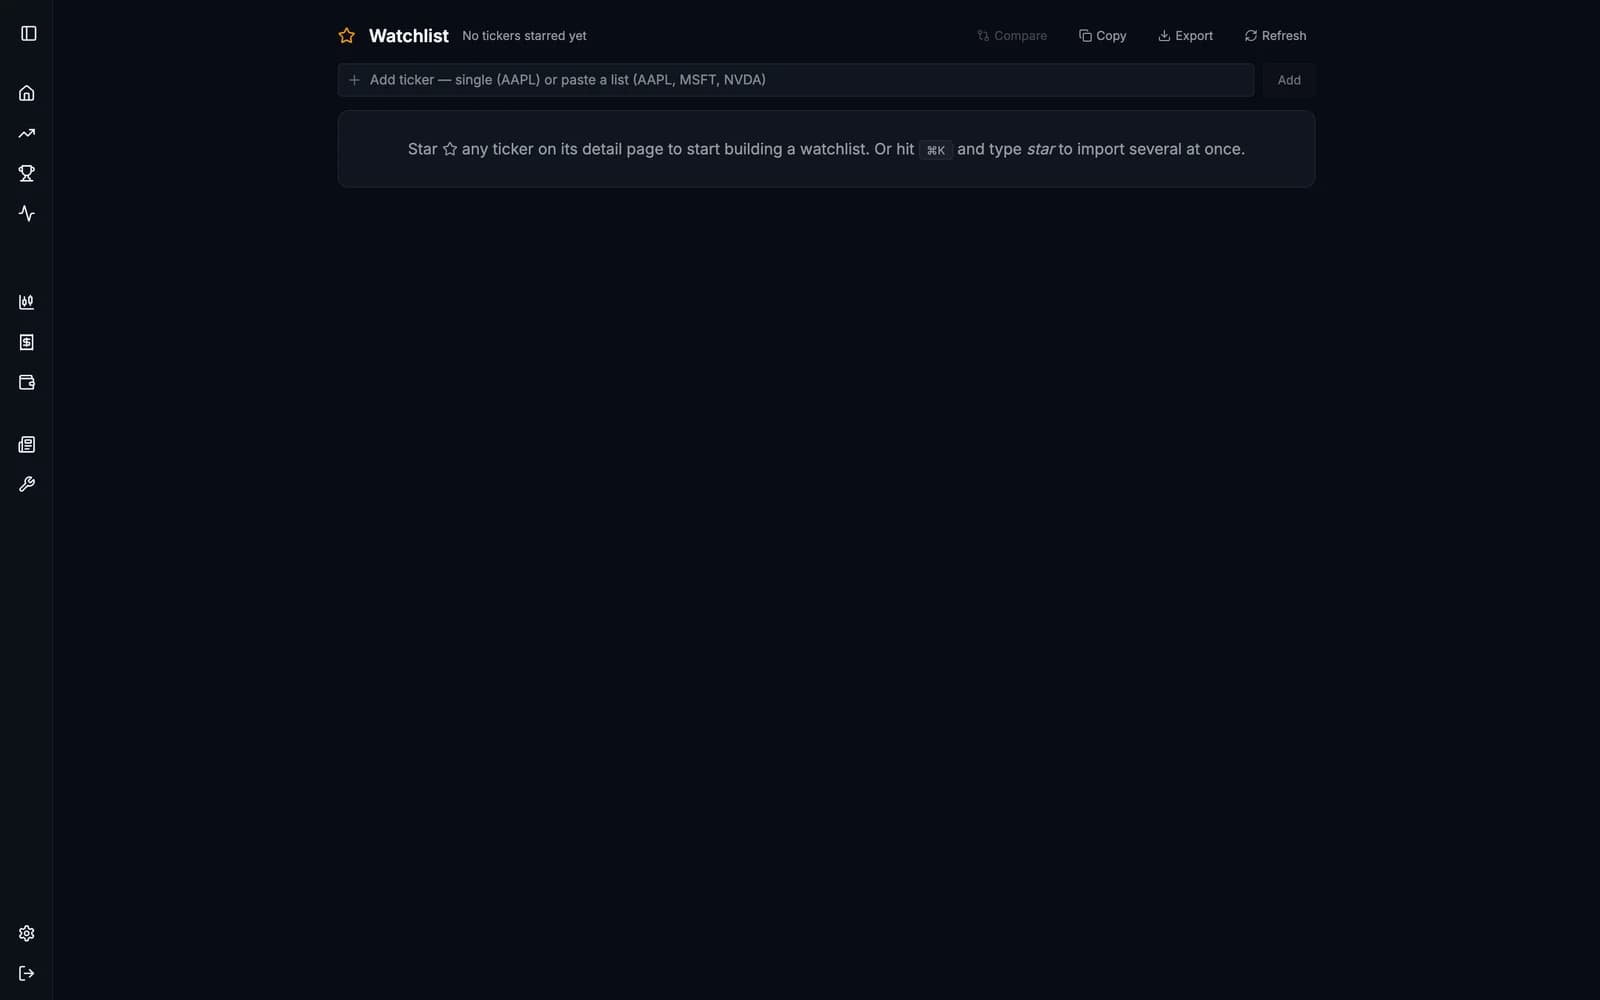
Watchlist
Empty stateStarred tickers with comparison and export — shown before any ticker has been added.
/watchlist
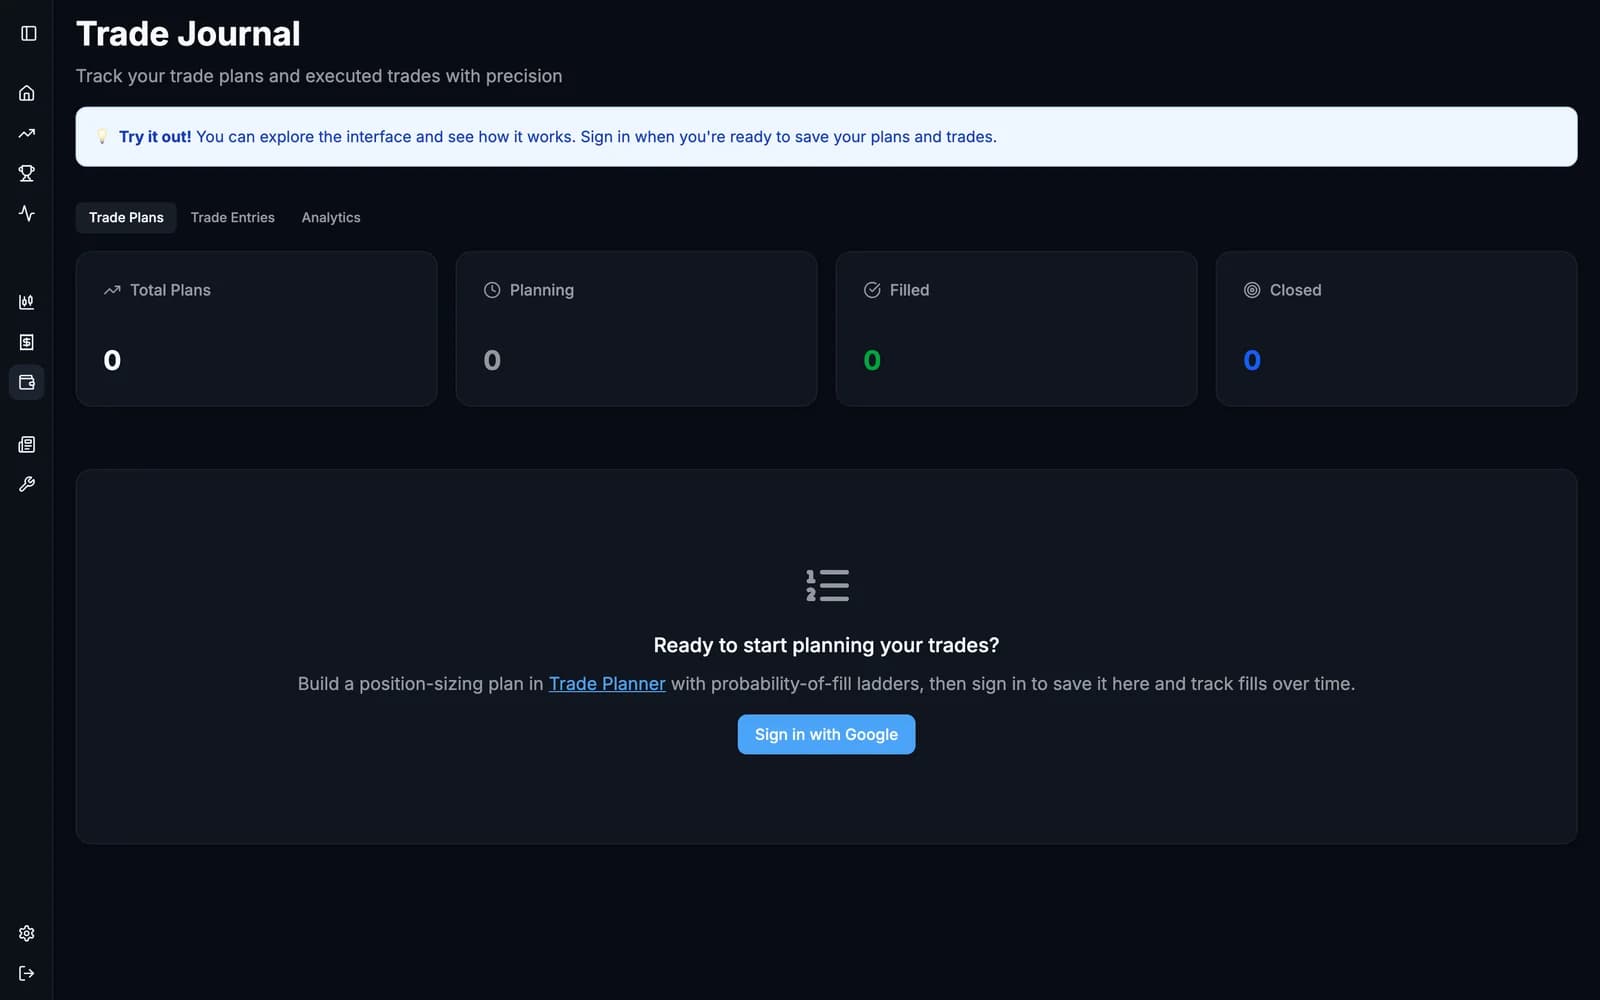
Trade Journal
Empty statePlans, fills and analytics for every trade — shown before any plan is saved.
/trades
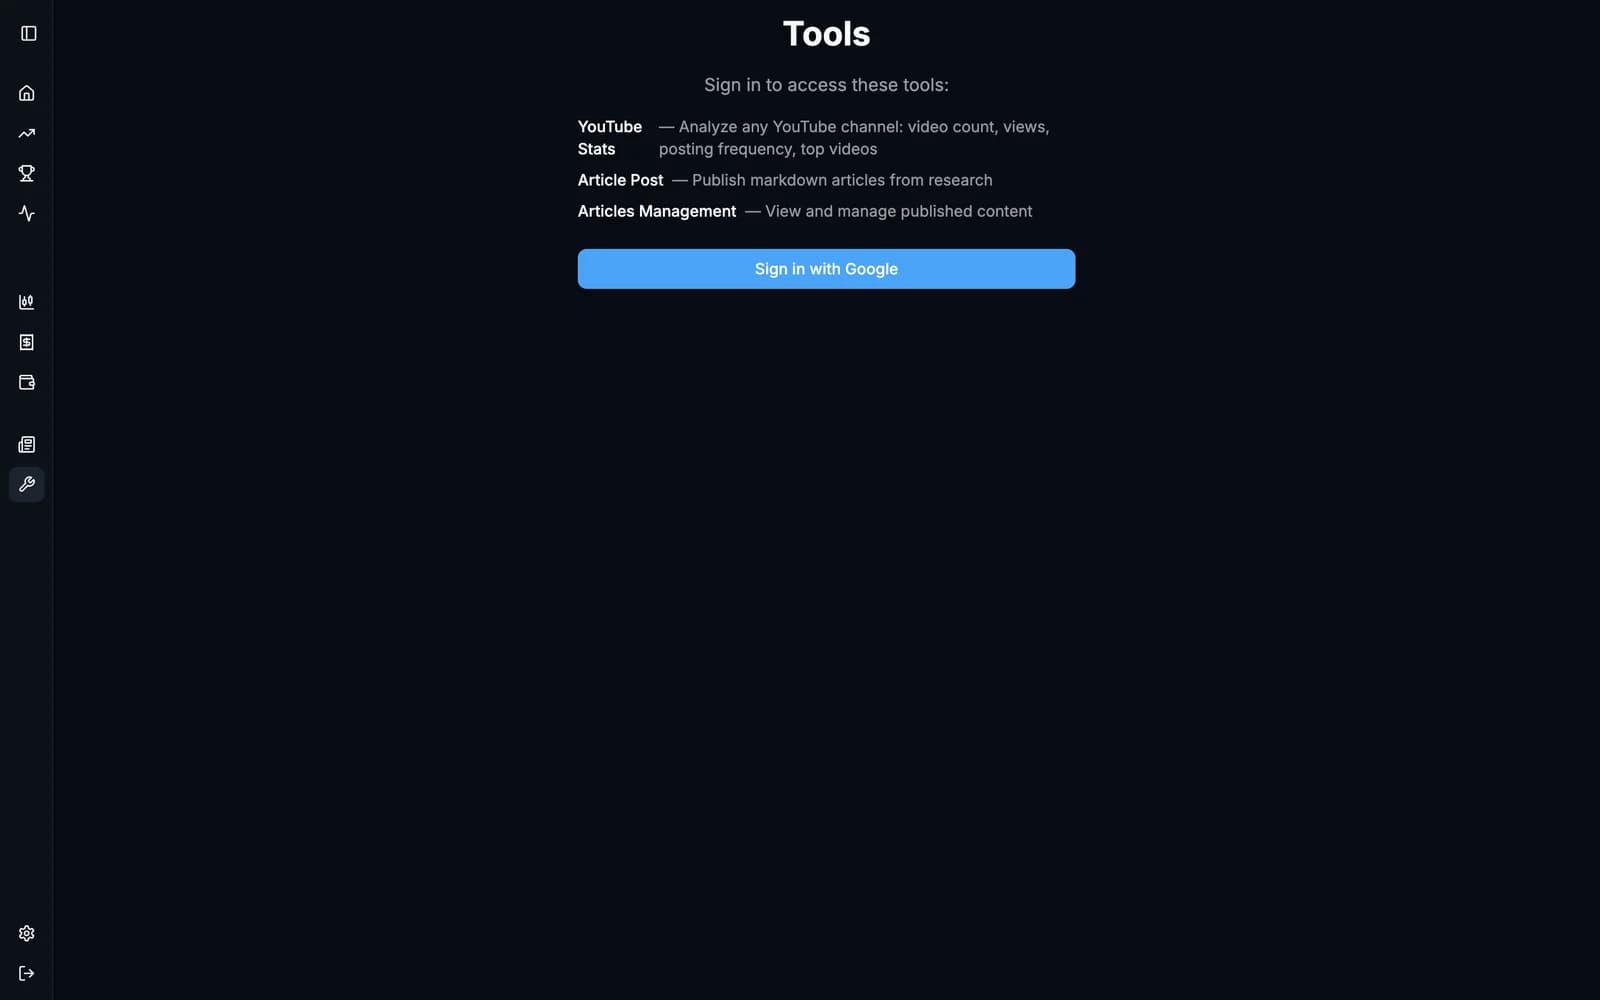
Tools
Sign-in requiredA small set of internal tools — channel stats and article publishing — kept behind a sign-in.
/tools
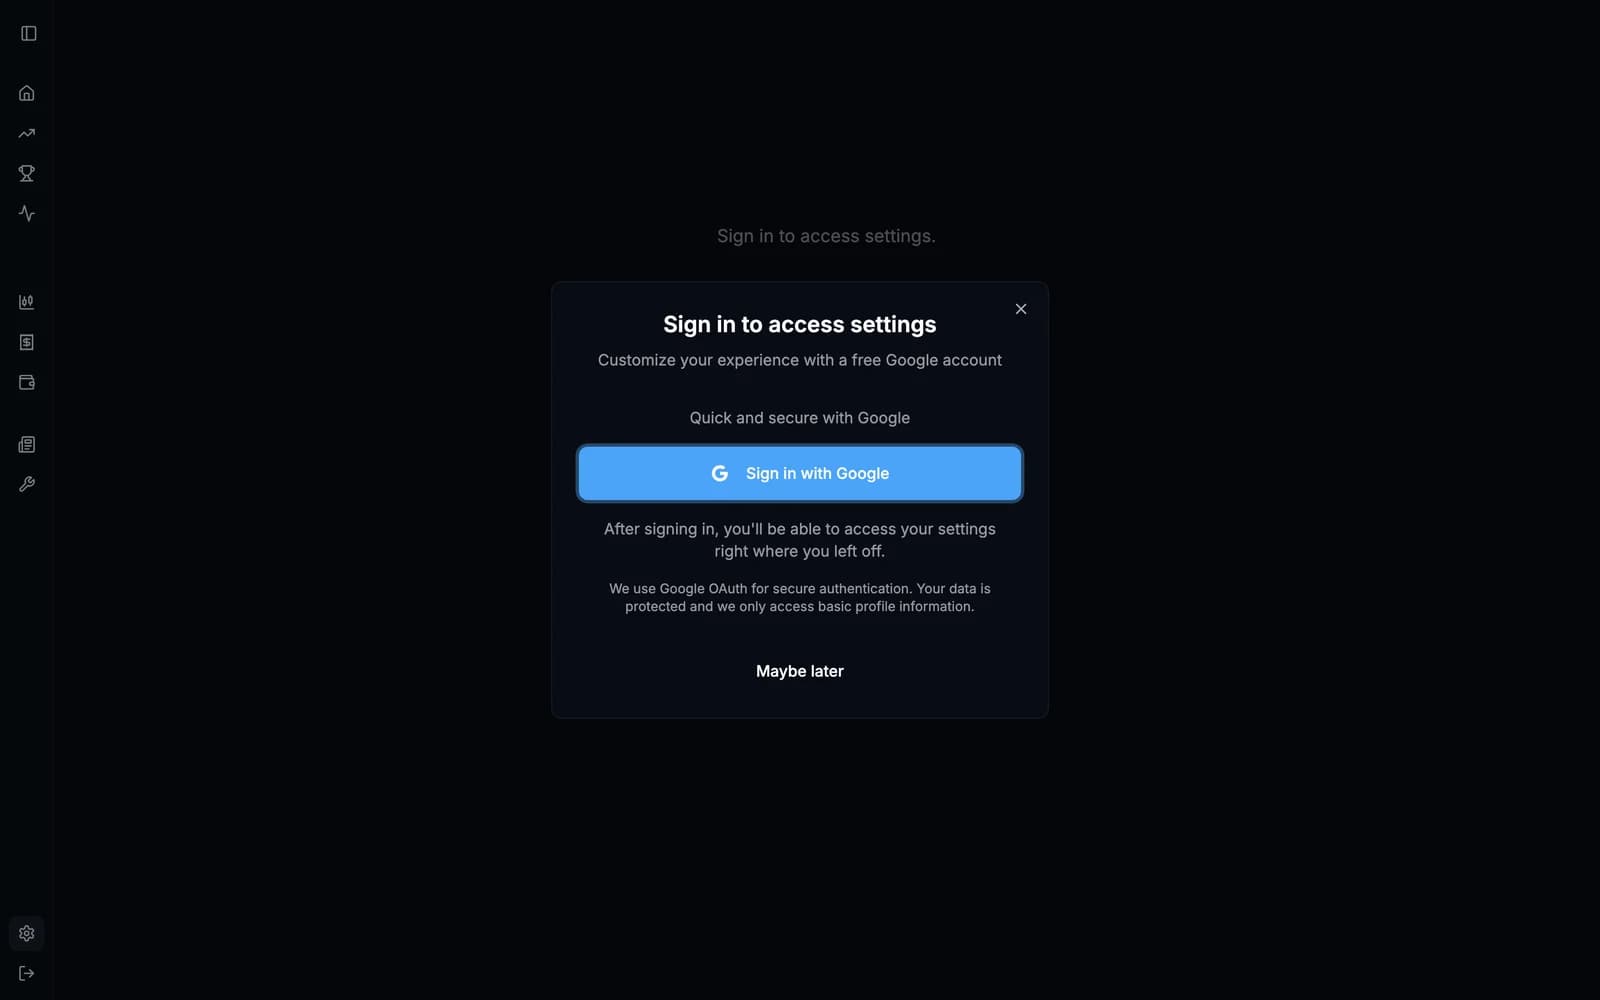
Settings
Sign-in requiredAccount settings sit behind Google sign-in; this is what a signed-out visitor sees.
/settings